Appendix B: Debug your project in VSCode
Purpose
Explore options for debugging a target within a compiled application.
Overview
Debugging is an important tool for embedded development. Zephyr and VSCode offer several options for connecting a debugger to the target to see code flow and interrogate variables at different points of your project's operation.
Procedure
1. These line numbers assume you have just completed Lab 1. If you are at another point in your lab work, please either revert to the end of Lab 1 or adjust line numbers and variables to match your current code state.
2. Ensure that your latest code is compiled and flashed to your board, then launch the debugger:
- Ubuntu
- macOS
- Windows
(.venv) $ cd ~/zephyrproject && west debug
(.venv) $ cd ~/zephyrproject && west debug
(.venv) C:\...\zephyrproject> west debug
3. After this command completes, the console will leave you in a (gdb) prompt. Depending on your terminal window size, you may need to hit the Return key a few times to reach this prompt. There are several ways to interact with GDB (type help to learn more), but one useful option is to use the Text User Interface:
(gdb) tui enable
4. Add a breakpoint to your GDB session, then continue operation until the breakpoint is hit:
(gdb) break main.c:44
(gdb) continue
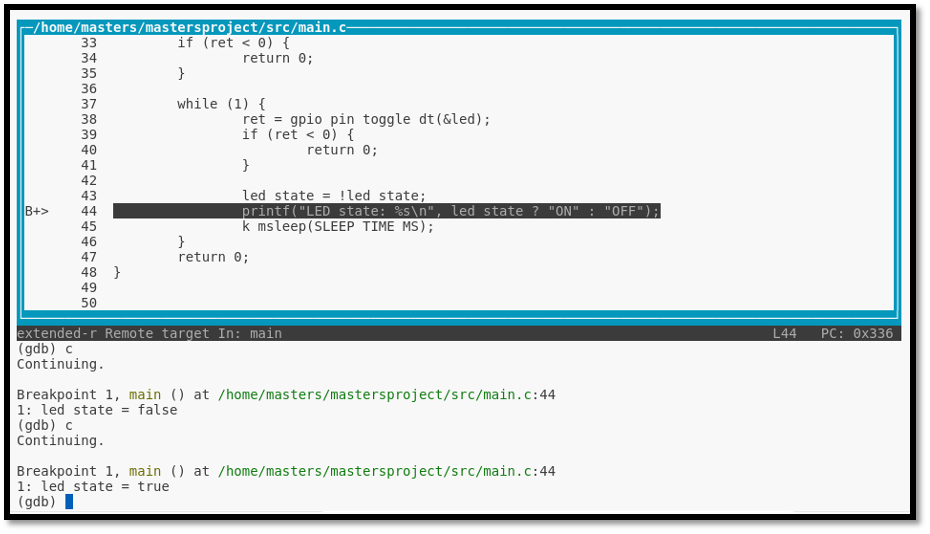
5. The device will now run until the breakpoint at main.c line 44 is reached. When operation is broken at that point, view the value of a variable:
(gdb) display led_state
(gdb) c
Observe the displayed value of the variable led_state on subsequent loops of the main loop, and verify that this variable matches the state of LED0 on your board:
6. Exit GDB and return to your venv command prompt:
(gdb) exit
If prompted, choose y to quit the active session.